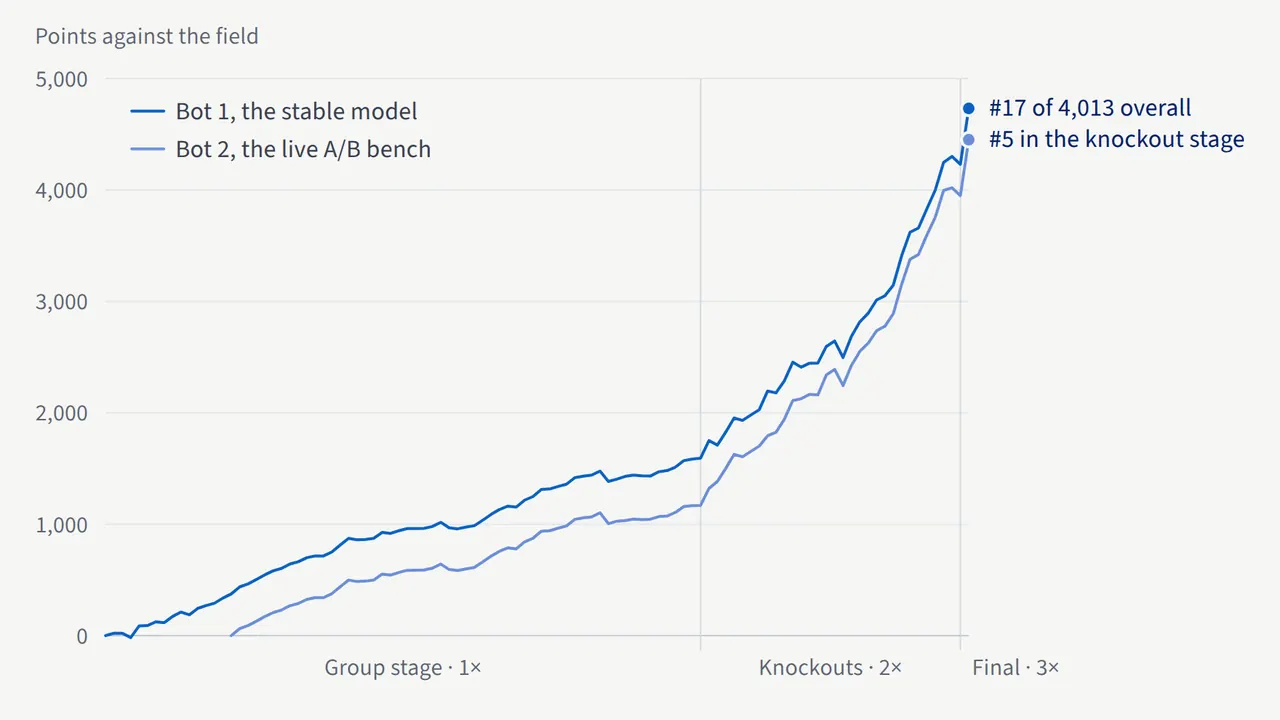
Match by match: knockout forecasts counted double and the final triple; the final alone moved my first bot from 31st to 17th.
The Jump Trading Probability Cup asked for a probability on about ten yes/no questions in each of the 104 World Cup matches, scored against the field. My first bot finished #17 of 4,013; my second finished #5 in the knockout stage.
The engine never rates teams itself: it anchors every answer on the betting market’s odds and models only what the market does not price. A Claude Code agent ran it in production for 38 days, under rules I set: every number came from the pipeline, and every submission was checked.
What I did
Built the pricing engine: one Dixon–Coles scoreline grid, fitted to de-margined bookmaker and Polymarket odds, answers every goal question consistently.
Fitted negative-binomial models for corners, cards, shots and fouls on odds-implied scoring rates from ~41k club matches; player props follow the confirmed lineup.
Mapped every question to one of 65 families, building and testing 19 new ones during the knockouts, each on the day it appeared.
Designed the agent operations: a Claude Code agent ran it for 38 days, scheduling passes before each kickoff, researching lineups and verifying every submission.
Ran my second bot as a live A/B bench: a change reached my main bot only after winning its own settled markets.
Figures
The engine anchors every answer on the market’s odds and models only what the market does not price; a Claude Code agent ran both entries under my rules.Hover over a box, or tab to it, for how that step works.Tap a box for how that step works.Betting odds. Every answer starts from the market: bookmaker and Polymarket prices for each match. The engine never rates teams itself.Fair probabilities. The odds are de-margined, so the bookmaker’s built-in margin does not leak into the forecasts.Scoreline grid. One Dixon–Coles grid of scoreline probabilities, fitted to those odds, answers every goal question, so no two answers contradict each other.Count models. Corners, cards, shots and fouls come from negative-binomial models on odds-implied scoring rates from ~41k club matches.Player props. Expected minutes come from the confirmed starting XI, pulled automatically before kickoff.65 question families. Each yes/no question maps to one of 65 families; 19 new ones were built and tested during the knockouts, each on the day it appeared.Claude Code agent. Under my rules it scheduled passes 50 minutes before kickoffs, researched lineups and verified every submission; every number came from the pipeline.First bot · stable. The stable configuration. Live, its forecasts averaged 42.2% where 42.2% happened; the crowd’s averaged 47.1%.Second bot ·A/B bench. It tried one change at a time against the first; five constants reached the first bot, each only after winning its own settled markets.
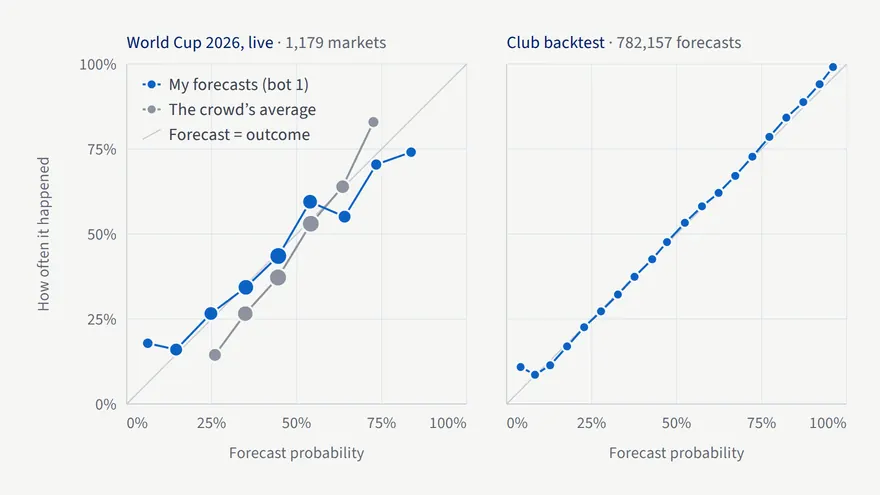
Forecast against outcome. Live, my forecasts averaged 42.2% where 42.2% happened; the crowd averaged 47.1%. The club backtest held within 2 points of the diagonal.
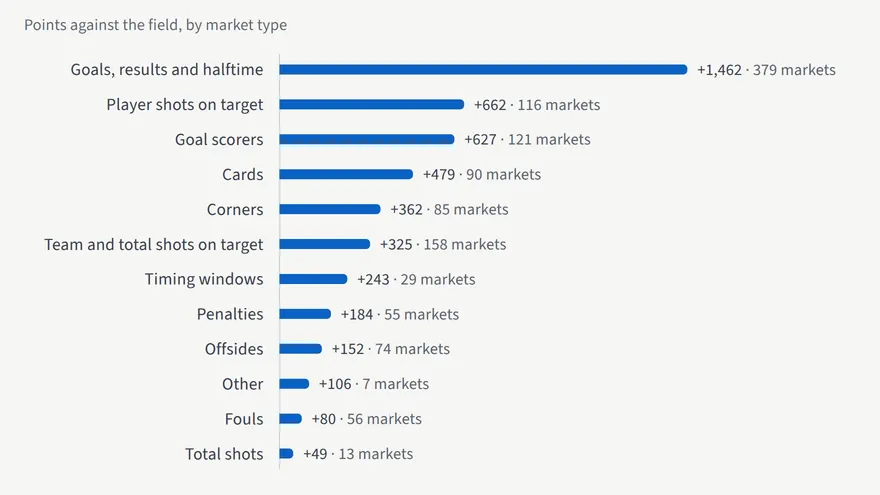
Where the points came from: every market type scored above the field.
Built with
Python ·NumPy ·SciPy ·pandas ·statsmodels ·Claude Code ·SportsPredict Model API ·DraftKings and Polymarket odds ·StatsBomb ·football-data.co.uk
Credits
Odds from DraftKings (via ESPN) and Polymarket; event data from StatsBomb open data; club results and closing odds from football-data.co.uk; player season rates from API-Football. Operated with Claude Code. Not affiliated with Jump Trading, SportsPredict or FIFA.